
Define what the numbers mean
Revenue, completed tasks and active customers need shared definitions. We clarify the calculation and time period so different views do not quietly tell different stories.


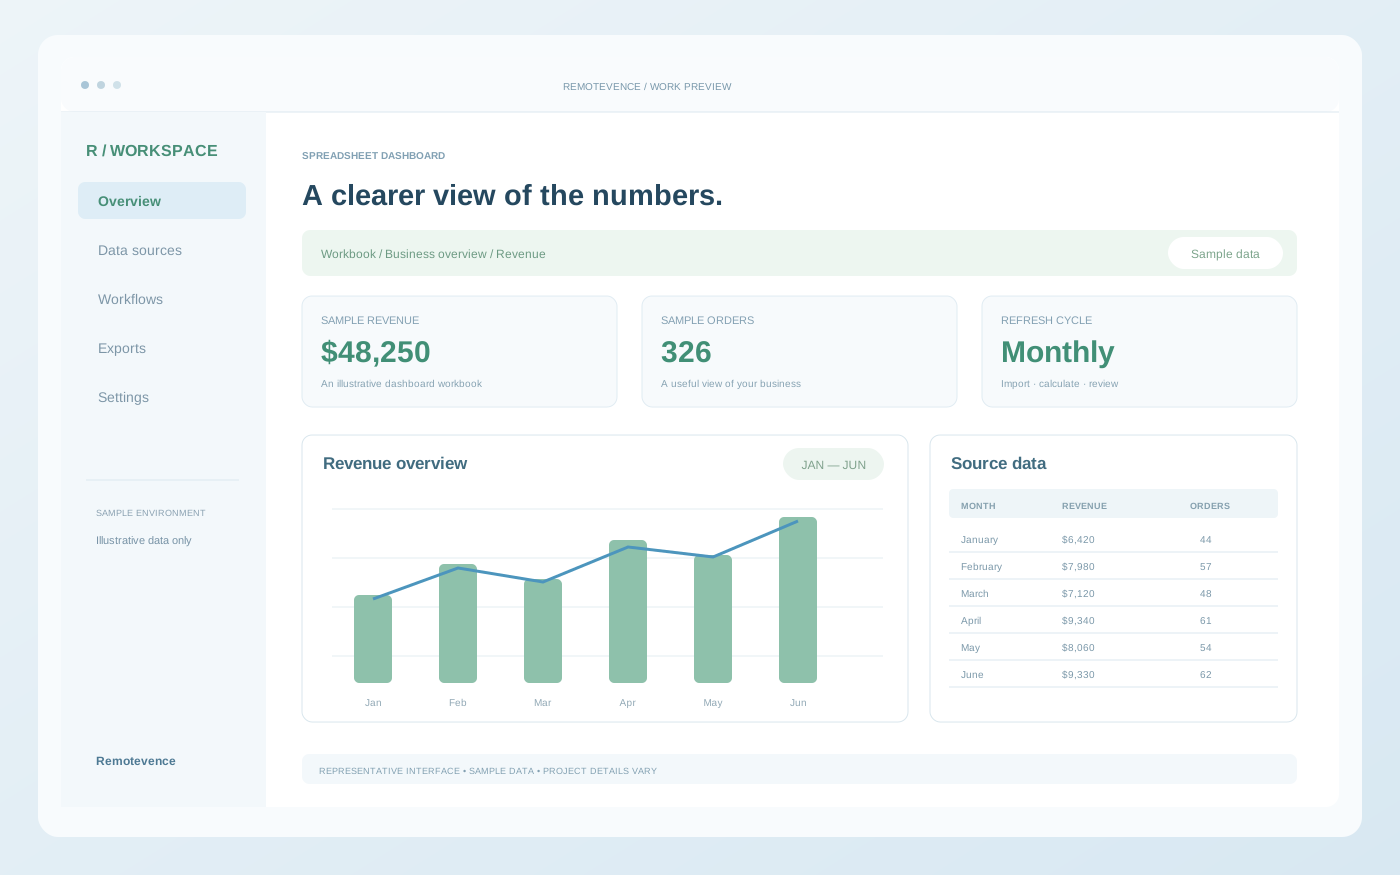
Bring your numbers together, understand what they mean and build reporting that helps your team decide what to do next.
Every project begins with an agreed brief. Your proposal defines the exact deliverables, responsibilities and timeline.
We agree the decisions the analysis needs to support, then assess the available sources. Definitions are documented before charts are built, so totals and comparisons mean the same thing across reports. Data quality issues are made visible rather than hidden behind a polished dashboard.
The final format follows how your team works: a spreadsheet model, an interactive dashboard, a scheduled report or a documented analysis pipeline. We distinguish observed patterns from assumptions and make refresh steps reproducible so the work remains useful after delivery.
A report becomes useful when the question behind it is clear. We agree the measures, source material and audience before choosing how to present the information.
Revenue, completed tasks and active customers need shared definitions. We clarify the calculation and time period so different views do not quietly tell different stories.
Files and systems often contain missing values, duplicate entries or inconsistent labels. We discuss those limits and agree what should be cleaned, flagged or left visible.
An overview for an owner differs from a working report for a team. We choose the level of detail, comparisons and filters around the decisions that audience needs to make.
You do not need a finished specification. These details help us understand where you are now and what the work needs to support.
The best work is clear on the surface, considered in the detail and connected to the way your business operates.
Open a card to find your answer.
Ask something elseYes. We can standardise fields, identify duplicates, validate formats and document the changes made.
Where the data sources support dependable access, refresh workflows can be scoped with clear schedules and failure handling.
Agreed source transformations, metric definitions and reusable outputs are included in the handover scope.

Related services that can extend this project.
 Sheets & Excel
Replace fragile manual work with organised sheets, dependable formulas and reporting your team can understand and maintain.
 Export solutions
Prepare, transform and export business information into the formats your systems, partners and teams can actually use.
 Scraping & extraction
Collect accessible information and turn it into clean, structured outputs for research, catalogue work and business analysis.
Start with your goals. We’ll define the right deliverables, integrations and next steps.
Discuss data analysis